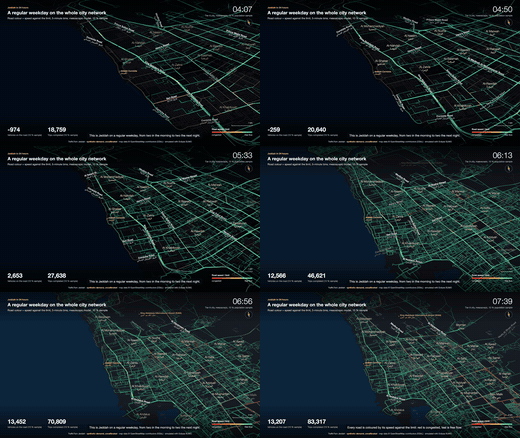
city-24h
The weekday baseline as a 24-hour time-lapse across the whole city (Tier A, mesoscopic).
TrafficTwin simulates a full 24-hour day for the whole city on the real OpenStreetMap road network, with demand from a synthetic population. It answers policy questions (remote work, staggered school hours, Ramadan, bus lines, road pricing, Loop tunnels), injects events into microscopic focus windows, and ranks emergency response plans for a human to approve. Built on Eclipse SUMO, Python and deck.gl; Apache-2.0.
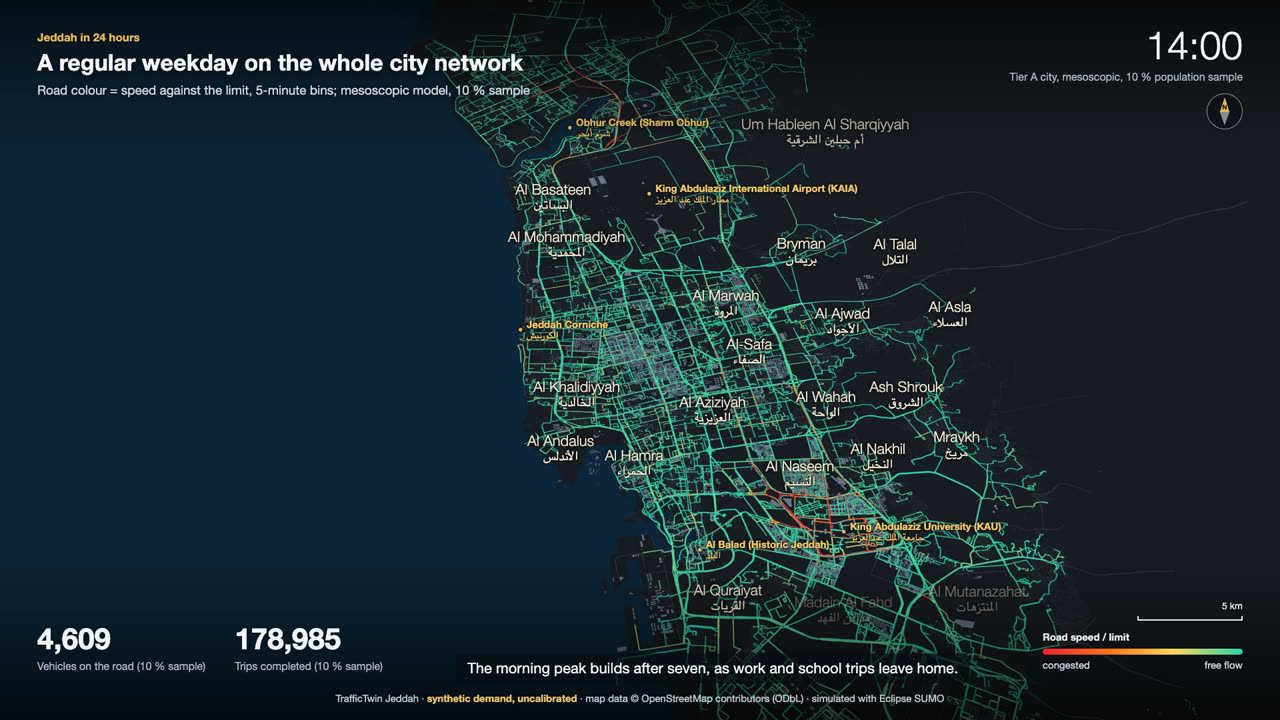 Showreel: eight films, 2 min 51 s, rendered from the simulation runs
Each film is rendered from real simulation outputs (edge bins, vehicle trajectories, event and strategist reports), one per simulation mode. Previews are 6-second GIFs; the full 1080p MP4s are attached to the v0.1.0 release. Scenarios are fictional.
The weekday baseline as a 24-hour time-lapse across the whole city (Tier A, mesoscopic).
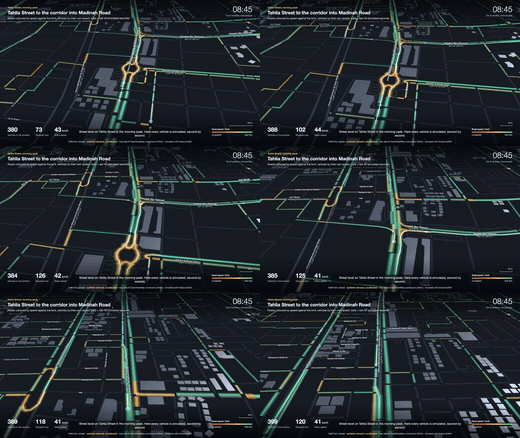
Street level along Tahlia Street in the morning peak, vehicles coloured by speed (Tier B).
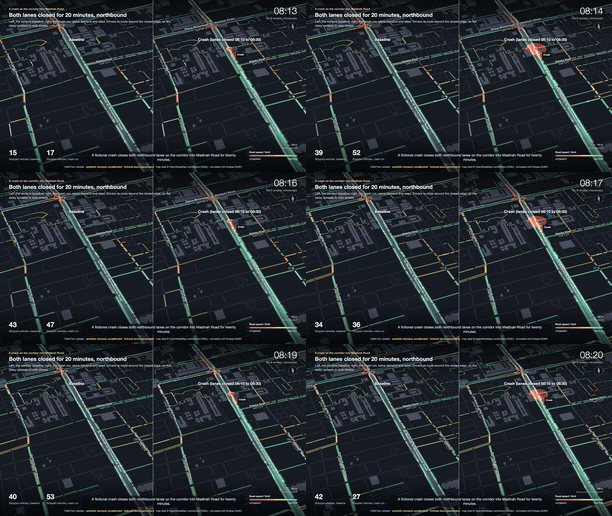
A crash on the corridor into Madinah Road, split-screen against its baseline.
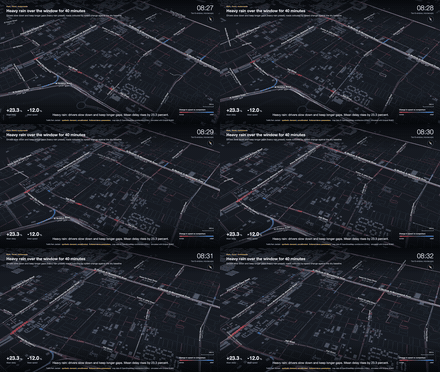
Heavy rain, a storm flood with closed flood sites, and a motorcade.
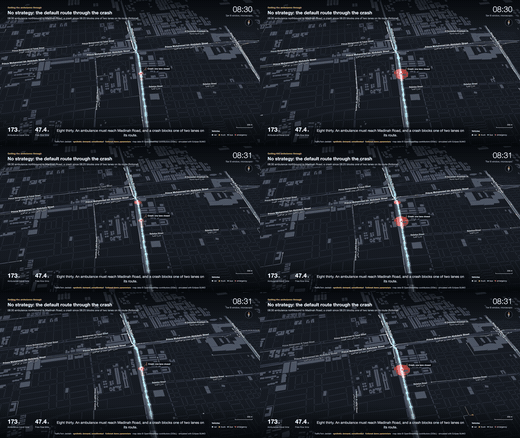
An ambulance at 08:30: no strategy, then the top 3 ranked options with their reasons.
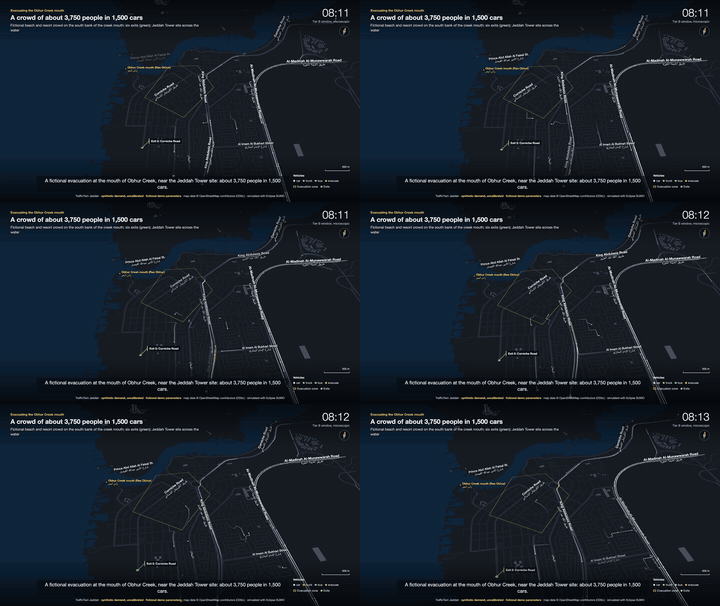
Phased release with contraflow from the Obhur Creek mouth near the Jeddah Tower site (fictional scenario).
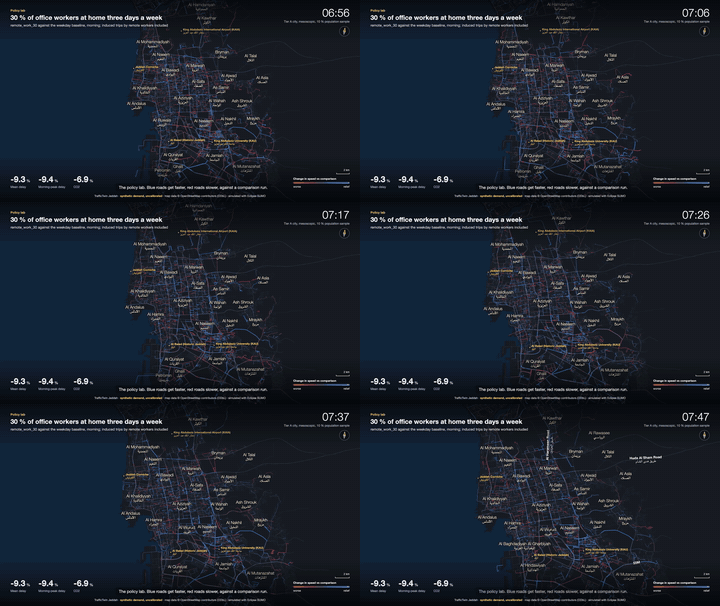
Remote work, staggered schools and a cordon charge in difference mode.
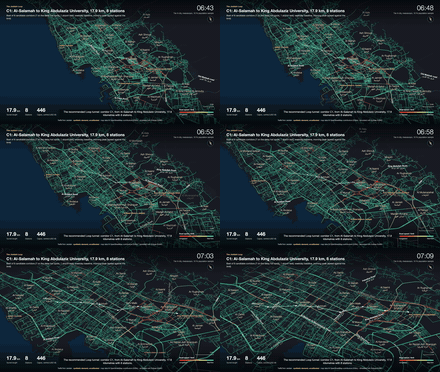
The recommended Loop tunnel C1 against the weekday baseline.
All eight films as 20-second excerpts with title cards.
The model sited candidate Boring-Company-style Loop corridors, simulated each on the city model, and swept operating policies under measured (Las Vegas) capacity.
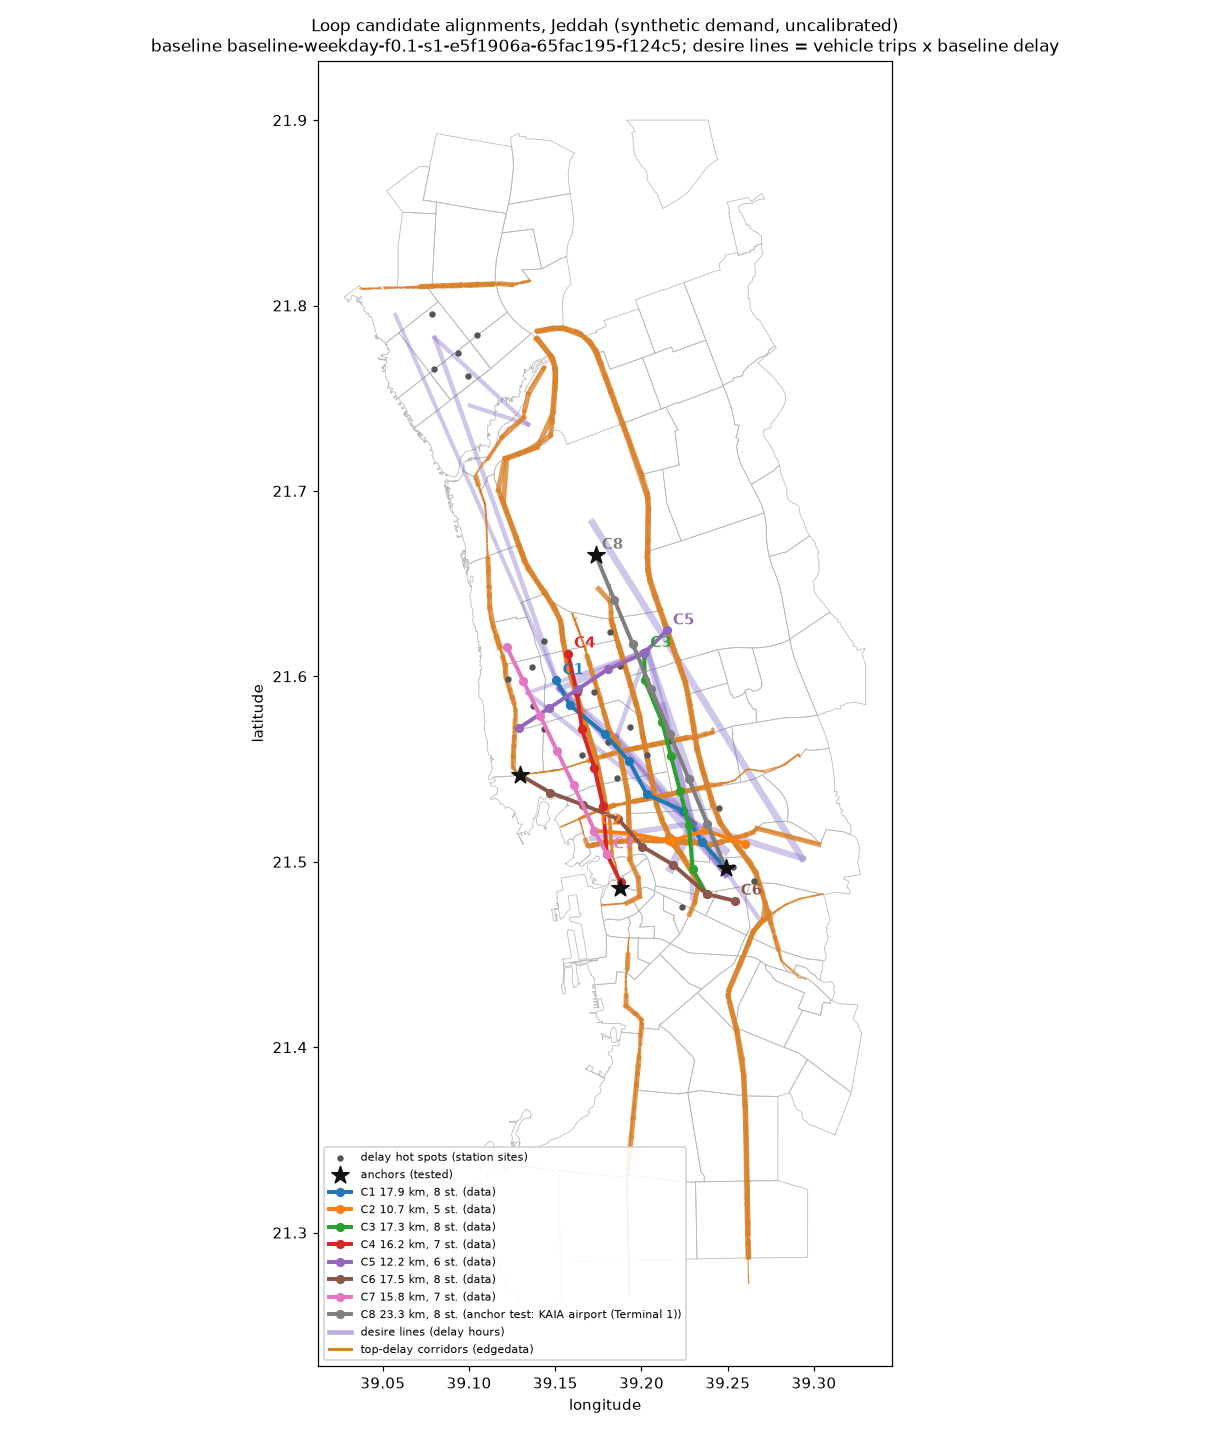
10 % sample, seed 1 and 2, gridlock-affected baseline; shift share is an assumption (no mode-choice model). Full method and caveats: docs/loop.md.
Changes against the matching baseline day, same seed, 10 % population sample on the city model (Tier A, mesoscopic). Run-to-run noise is about ±2 % on delay and VHT; a negative change (green) is an improvement.
| policy | compared with | mean delay | AM-peak delay | VKT | VHT | CO2 |
|---|---|---|---|---|---|---|
| 30 % remote work | weekday | -9.3 % | -9.4 % | -1.6 % | -7.7 % | -6.9 % |
| schools start 60 min staggered | matched control | -1.1 % | -9.1 % | +0.2 % | -0.7 % | -0.6 % |
| Friday | weekday | -14.9 % | -98.0 % | -3.3 % | -12.5 % | -13.0 % |
| Ramadan weekday | weekday | -3.8 % | -33.1 % | +13.8 % | +12.5 % | +12.4 % |
| bus line on Tahlia | weekday | +2.5 % | +0.7 % | -0.2 % | +1.9 % | +1.7 % |
| central cordon charge | matched control | +20.1 % | +8.6 % | -0.4 % | +12.4 % | +10.4 % |
| Corniche Road closed | matched control | +1.1 % | +0.7 % | -0.1 % | +0.7 % | +0.6 % |
| Ramadan + 30 % remote work | Ramadan weekday | -9.8 % | -13.9 % | -1.2 % | -7.9 % | -7.2 % |
| ride-hail share +10 points | weekday | +1.5 % | -0.5 % | +2.7 % | +5.2 % | +4.7 % |
Colour marks changes larger than the ±2 % noise. Synthetic demand, uncalibrated; the baseline network teleports about half of all vehicles (missing lane counts in OSM), so read these as comparisons between policies, not forecasts. Details: docs/policies.md.
One engine at two resolutions. Tier A runs all of Jeddah mesoscopically for policy questions; Tier B cuts a 3-25 km² focus window out of it and runs every vehicle for events and the strategist. Layers only talk through run directories.
Policies change the population or the network before a run; events act through TraCI during a run. The AI recommends; a human approves high-impact actions. Full diagram: docs/architecture.md.
macOS (Apple silicon) or Linux with uv, Node 22+, make and curl. The demo window runs on any recent laptop; the city adds a 243 MB download and peaks at about 3 GB of RAM (measured on an 18 GB M3 Pro).
git clone https://github.com/alturkestani/TrafficTwin.git TrafficTwin && cd TrafficTwin
make demo CITY=0     # demo window only: setup + demo runs, then the viewer on http://localhost:5173
make demo            # adds the Jeddah city network and a one-hour city run (about 7 min first time)
make test            # ruff, pytest on the demo window, web typecheck
Everything else (24 h city baseline, policies, events, strategist, evacuation, Loop, calibration, films) is in the README.